Chicago Parking Ticket Visualization
Intro
Hi there! In this post, I want to show off a fun little web app I made for visualizing parking tickets in Chicago, but because I've spent so much time on the overall project, I figured I'd share the story that got me to this point. In many ways, this work is the foundation for my interest in public records and transparency, so it has a very special place in my heart.
If you're here just to play around with a cool app, click here. Otherwise, I hope you enjoy this post and find it interesting. Also - please don't hesitate to share harsh criticism or suggestions. Enjoy!
Project Beginnings
Back in 2014, while on vacation, my car was towed for allegedly being in a construction zone. The cost to get the car out was quoted at around $700 through tow fees and storage fees that increase each day by $35. That's obviously a lot of money, so the night I noticed the car was towed, I began looking for ways to get the ticket thrown out in court. After some digging, I found a dataset on data.cityofchicago.org which details every street closure, including closures for construction. As luck would have it, the address that my car was towed at had zero open construction permits, which seemed like a good reason to throw out the fines. The next day I confirmed the lack of permits by calling Chicago's permit office - they mentioned they only thing found was a canceled construction permit by Comed. That same day, I scheduled a court date for the following day.
When I arrived in the court room, I was immediately pulled aside by a city employee and was told that my case was being thrown out. They explained that the ticket itself "didn't have enough information", but besides that I wasn't told much! The judge then signed a form that allowed the release of my car at zero cost.
At this point, I'd imagine most folk would just walk away with some frustration, but would be overall happy and move on. For whatever reason, though, I'm too stubborn for that - I couldn't get over the fact that Chicago didn't just spend five minutes checking the ticket before I appeared in court. And what bothered me more was that there isn't some sort of sorts automated check. Surely Chicago has some process in place within its $200 million ticketing system to make sure it's not giving out invalid tickets... Spoiler: it doesn't.
The more I thought about it, the more I started wondering why Chicago's court system only favors those who have the time and resources to go to court and started wondering if it was possible to automate these checks myself using historical data. The hunch started based on what I'd seen from the recent "Open Gov" movement in to start making data open to the public by default.
When I first started, I mostly just worked with some already publicly available datasets previously released by several news organizations. WBEZ in particular released a fairly large dataset of towing data that, while it was a compelling dataset, it unfortunately ultimately wasn't useful for my little project. So instead, I started working on a similar goal to programatically find invalid tickets in Chicago. That work and its research led to my very first FOIA request, where after some trial and error, received the records for 14m parking tickets.
Trial Development and Trial Geocoding
With the data at hand, I started throwing many, many unix one liners and gnuplot at the problem. This method worked well enough for small one-off checks, but for anything else, it's a complete mess of sed and awk statements. After unix-by-default I moved on to Python, where I made a small batch of surprisingly powerful, but scraggly scripts. One script, for example, would check to see whether a residential parking permit ticket was valid by comparing a ticket's address against a set of streets and its ranges found on data.cityofchicago.org. The script ended up finding a lot of residential permit tickets given outside of the sign's listed boundaries. Sadly though, none of the findings were relevant, since a ticket is given based on the physical location of the sign, not what the sign's location data represents. These sorts or problems ended up putting a halt to these sorts of scripts.
With the next development iteration, I switched to visualizing parking tickets, where I essentially continued until today. Problem was, the original data had no lat/lng and had to be geocoded..
So, back when I first started doing this, there weren't that many geocoding services that were reasonably priced. Google was certainly possible, but its licensing and usage limits made Google a total no-go. The other two options I found were from Equifax (expensive) and the US Post Office (also expensive). So I went down a several hundred hour rabbit hole of attempting to geocode all addresses myself - entirely under the philosophy that all tickets had a story to tell, and anything lower than 90% geocoding was inexecusable.
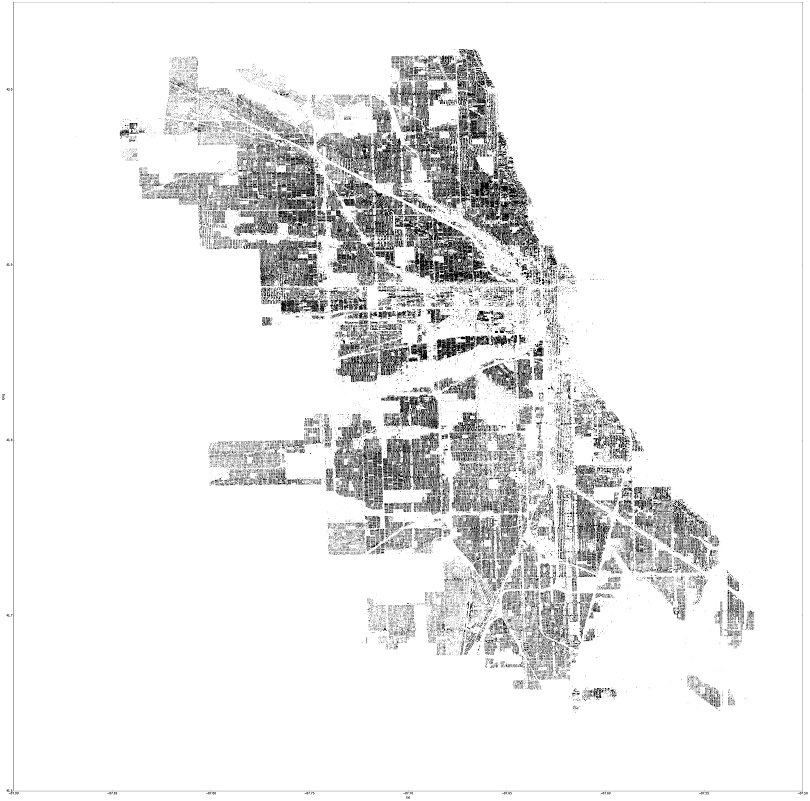
The first attempt at geocoding was decent, but only matched about 30% of tickets. It worked by tokenizing addresses using a wonderful python library called usaddress, then comparing the "string distance" of a street address against a known set of address already paired with lat/long. It got me to a point where I could make my first map visualization using some simple plotting:
Jupyter Notebook
Still, with only 30% geocoded, I felt that I could do better through many different methods that continued to use string distance - some implementations much fancier than others. Other methods, ahem, used lots of sed and vim, which I'm still not proud of. There were some attempts where I got close to 90% of addresses geocoded, though I ended up throwing each one out in fear that the lack of validation would bite me in the future. Spoiler: it did.
Eventually, my life was made much easier thanks to the folks at SmartyStreets, who set me up an account with unlimited geocoding requests. By itself, SmartyStreets was able to geocode around 50% of the addresses, but when combined with some of my string-distance autocorrection, that number shot up to 70%. It wasn't perfect, but it was "good enough" to move on, and didn't really require me to trust my own set corrections and the anxiety that comes with that.
Another New Dataset
Fast forward about six months - I hadn't gotten much further on visualization, but instead started focusing on my first blog post. A bit around that post, ProPublica published some excellent work on parking tickets and ended up releasing its own tickets datasets to the public, one of which was geocoded. I'm happy to say I had a small part in helping out with, and then started using it for my own work in the hopes of using a common dataset between groups.
More Geocoding Fun
A high level of ProPublica's geocoding process is described in pretty good detail here, so if you're interested in how the geocoding was done, you should check that out. In brief, the dataset's addresses were geocoded using Geocodio. The geocoding process they used was dramatically simplified by replacing each address's last two digits with zeroes. It worked surprisingly well, and brought the percent of geocoded tickets to 99%, but this method had the unfortunate side effect of reducing mapping accuracy.
So, because I have more opinions than I care to admit about geocoding, I had to look into how well the geocoding was done.
Geocoding Strangeness
After a few checks against the geocoded results, I noticed that a large portion of of the addresses wasn't geocoded correctly - often in strange ways.
One example comes from the tendency of geocoders to favor one direction over the other for some streets. As can be seen below, the geocoding done on Michigan and Wells is completely demolished. What’s particularly notable here is that Michigan Ave has zero instances of “S Michigan” swapped to “N Michigan”.
| N Wells | S Wells | Total | |
|---|---|---|---|
| Total Tickets (pre-geocoding) | 280,160 | 127,064 | 407,224 |
| Unique Addresses (pre-geocoding) | 3,254 | 3,190 | 6,444 |
| Total Tickets (post-geocoding) | 342,020 | 37,611 | 379,631 |
| Unique Addresses (post-geocoding) | 40 | 57 | 97 |
| Direction is swapped | 246 | 54,309 | 54,555 |
| N Michigan | S Michigan | Total | |
|---|---|---|---|
| Total Tickets (pre-geocoding) | 102,225 | 392,391 | 494,616 |
| Unique Addresses (pre-geocoding) | 2,916 | 16,585 | 19,501 |
| Total Tickets (post-geocoding) | 15,760 | 509,485 | 512,401 |
| Unique Addresses (post-geocoding) | 136 | 144 | 280 |
| Direction is swapped | 102,225 | 0 | 102,225 |
Interestingly, the total ticket count for Wells drops by about 30k after being geocoding. This turned out to be from Geocodio strangely renaming ‘200 S Wells’ to ‘200 W Hill St’. Similar also happens with numbered addresses similar to “83rd St”, where a steet name is often renamed to "100th". 100th street's ticket count appears to have six times as many tickets as it actually does because of this.
These are just a few examples, but it's probably safe to say it's tip of the iceberg. My gut tells me that the address simplification had a major effect here. I think a simple solution of replacing the last two digits with 01 if odd, and 02 if even - instead of 0s - would do the trick.
Quick Geocoding Story
A few years ago, I approached the (ex) Chicago Chief of Open Data and asked if he, or someone in Chicago, was interested in a copy of geocoded addresses I’d worked on, since they don’t actually have anything geocoded (heh). He politely declined, and mentioned that since Chicago has its own geocoder, my geocoded addresses weren’t useful. I then asked if Chicago could run the parking ticket addresses through their geocoder – something that would then be requestable through FOIA. His response was, “No, because that would require a for loop”.
Hmmmmm.
Visualization to Validate Geocoding
In one of my stranger attempts to validate the geocoding results, I wanted to see whether it was possible to use the distance a ticketer traveled to check if a particular geocode was botched or not. It ended up being less useful I'd hoped, but out of it, I made some pretty interesting looking visualizations:
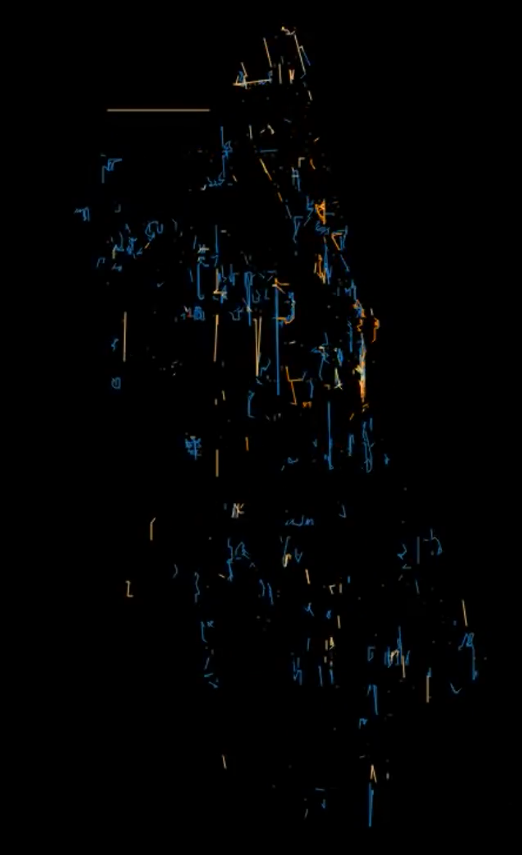
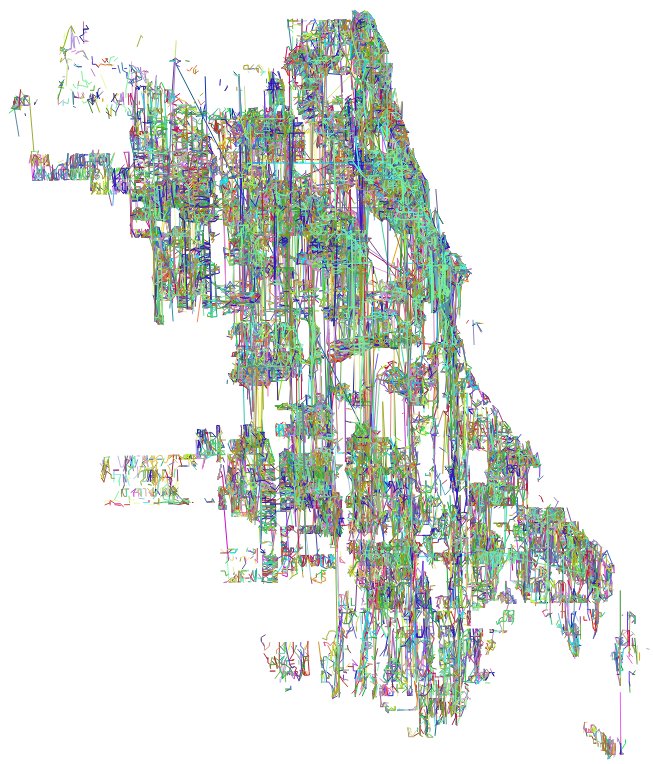
Left: Ticketer paths every 15 minutes with 24 hours decay (Animated). Right: All ticketer paths for a full month.
This validation code, while it wasn't even remotely useful, ended up being the foundation for what I'm calling my final personal attempt to visualize Chicago's parking tickets.
Final Version
And with that, here is the final version of the parking ticket visualization app. Click the image below to navigate to the app.
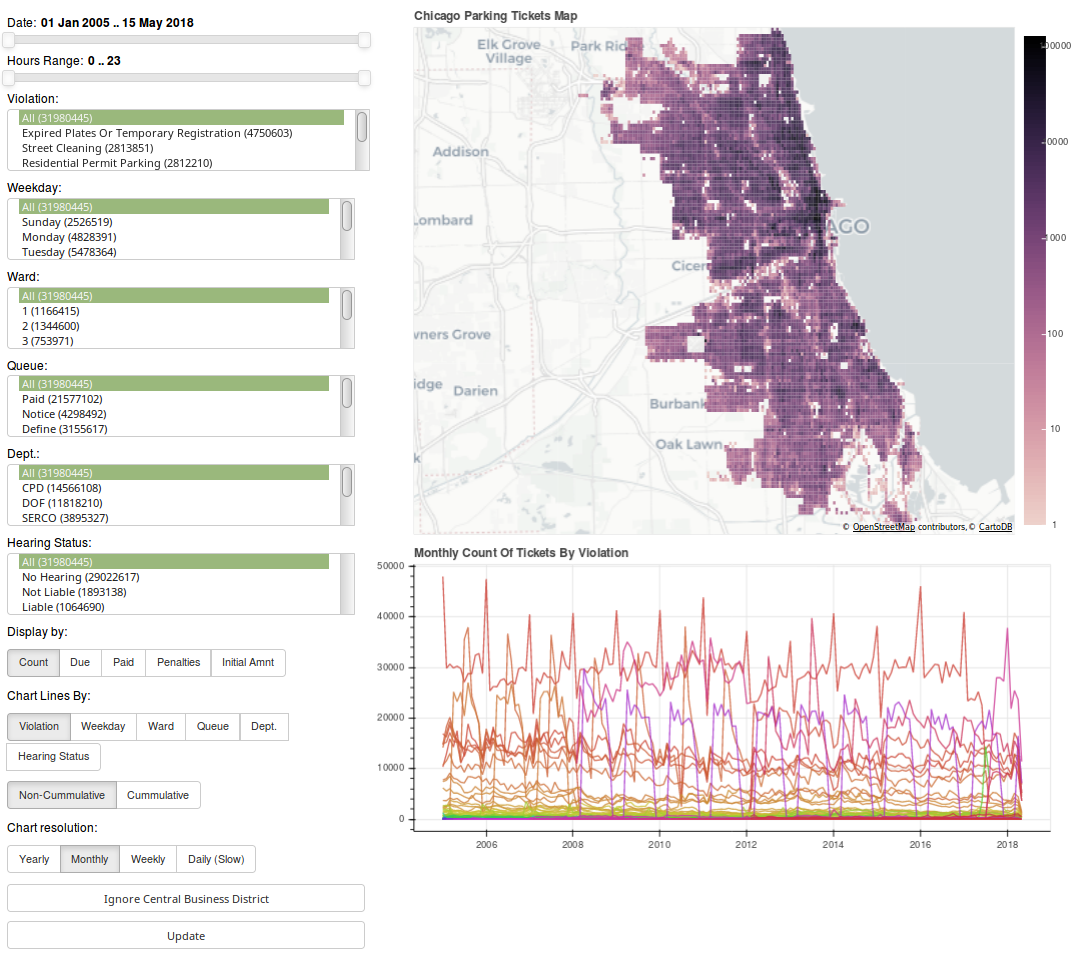
Bokeh Frontend
The frontend for the app uses a python framework named Bokeh. It's an extremely powerful interactive visualization framework that dramatically reduces how much code it takes to make both simple and complex interfaces. It's not without its (many) faults, but in python land, I personally consider it to be the best available. That said, I wish the Bokeh devs would invest a lot more time improving the serverside documentation. There's just way too much guesswork, buggy behavior, and special one-offs required to match Bokeh's non-server functionality.
Flask/Pandas Backend
The original backend was PostgreSQL along with PostGIS (for GeoJSON creation) and TimeScaleDB (for timeseries charting). Sadly, PostgreSQL started struggling with larger queries, combined with memory exhausting itself quicker than I'd hoped. In the end, I ended up writing a Flask service that runs in PyPy with Pandas as an in-memory data store. This ended up working surprisingly well in both speed and modularity. That said, there’s still a lot more room for speed improvement - especially in caching!
If I ever revisit the backend, I'll try giving PostgreSQL another chance, but throw a bunch more optimization its way.
Please feel free to check out the application code.
Interesting Findings
To wrap this post up, I wanted to share some of the things I've found while playing around with the app. Everything below comes from screenshots from the app, so pardon any loss of information.
Snow Route Tickets Outside 3AM-7AM
If you park your car in a "snow route" between 3AM-7AM, you will get a ticket. Interestingly, between the hours of 8am to 11pm, over 1,000 tickets have been given over the past 15 years - mostly by CPD. Of these, only 6% have been contested – 6 of which the car owner was still liable for some reason. The other 94% should have automatically been thrown out, but Chicago has no systematic way of doing this. Shame.
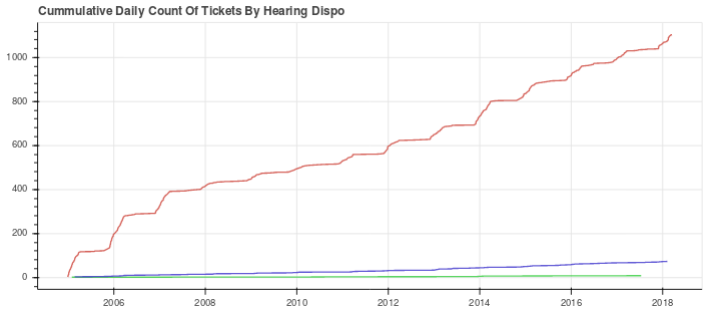
Highest value line = CPD's tickets.
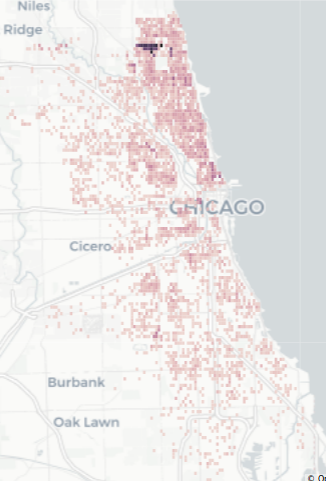
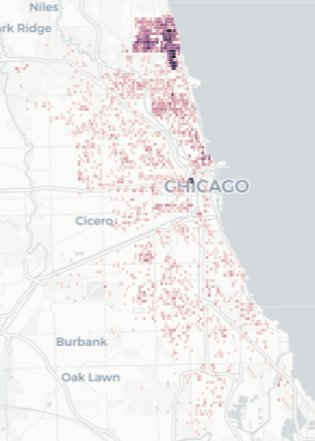
Expired Meter Within Central Business District – Outside of CBD.
Downtown Chicago has an area that's officially described as the “Central Business District”. Within this area, tickets for expired meters end up costing $65 instead of the normal $50. In the past 13 years, over 52k of these tickets have been given outside of the Central Business District. From those 52k, only 5k tickets were taken to court, and 70% were thrown out. Overall, Chicago made around $725k off the $15 difference. Another instance of where Chicago could have systematically thrown out many tickets, but didn't.
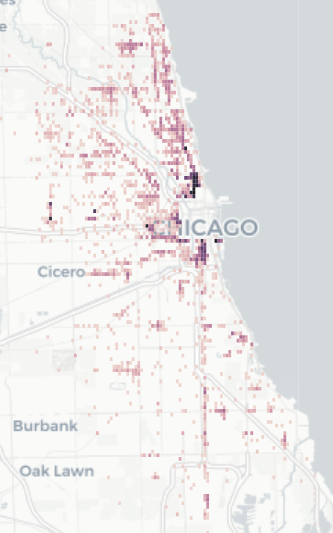
Downtown removed to highlight non-central business district areas.
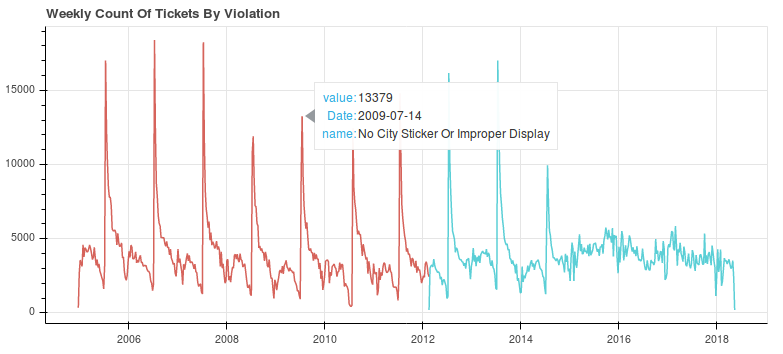
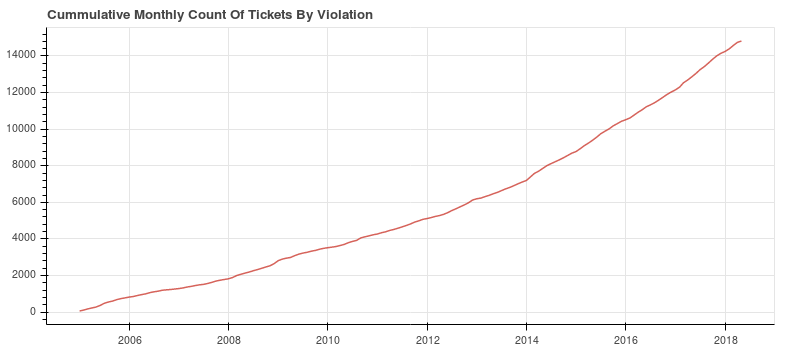
City sticker expiration tickets.. in the middle of July?
Up until 2015, Chicago's city stickers expired at the end of June. A massive spike of tickets is bound to happen, but what's strange is that the spike happens in the middle of July, not the start of it. At the onset of each spikes, Chicago is making somewhere between $500k and $1m. This is a $200 ticket that has a nonstop effect on Chicago's poorer citizens. For more on this, check out this great ProPublica article.
(The two different colors here come from the fact that Chicago changed the ticket description sometime in 2012.)
Bike Lane Tickets
With the increasing prevalence of bike lanes and the danger from cars parked in them, I was expecting to see a lot of tickets for parking in a bike lane. Unfortunately, that’s not the case. For example, in 2017, only around 3,000 tickets for parking in a bike lane were given. For more on this, click here.
Wards Have different Street Cleaning times
I found some oddities while searching for street cleaning tickets given at odd hours. Wards 48, 49 and 50 seem to give out parking tickets much later than the rest of Chicago. Then, starting at 6am, Ward 40 starts giving out tickets earlier than the rest of Chicago. Posted signs probably make it relatively clear that there’s going to be street cleaning, but it’s also probably fair to say that this is understandably confusing. Hopefully there’s a good reason these wards decided to be special.
What’s Next?
That's hard to say. There's a ton of work that needs to be done to address the systemic problems with Chicago's parking, but there just aren't enough people working on the problem. If you're interested in helping out, you should definitely download the data and start playing around with it! Also, if you're in Chicago, you should also check out ChiHackNight on Tuesday nights. Just make sure to poke some of us parking ticket nerds beforehand in #tickets on CHiHackNight's slack.
That said, a lot of these issues should really be looked at by Chicago in more depth. The system used to manage parking ticket information - CANVAS - has cost Chicago around $200,000,000, and yet it's very clear that nobody from Chicago is interested in diving into the data. In fact, based on an old FOIA request, Chicago has only done a single spreadsheet's worth of analysis with its parking ticket data. I hope that some day Chicago starts automating some ticket validation workflows, but it will probably take a lot of public advocacy to compel them to do so.
Unrelated Notes
Recently I filed suit against Chicago after a FOIA request for the columns and table names of CANVAS was was rejected with a network security exemption. If successful, I hope that the information can be used to submit future FOIA requests using the database schema as the foundation. I'm extremely happy with the argument I made, and I plan on writing about it as the case comes to a close.
Anywho, if you like this post and want to see more like it, please consider donating to my non-profit, Free Our Info, NFP which recently became a 501(c)(3). Much of the FOIA work from this blog (much of which is unwritten) is being filtered over to the NFP, so donations will allow similar work to continue. A majority of the proceedings will go directly into paying for FOIA litigation. So, the more donations I receive, the more I can hold government agencies accountable!
Hope you enjoyed.
Tags: tickets, foia, chicago, bokeh, visualization